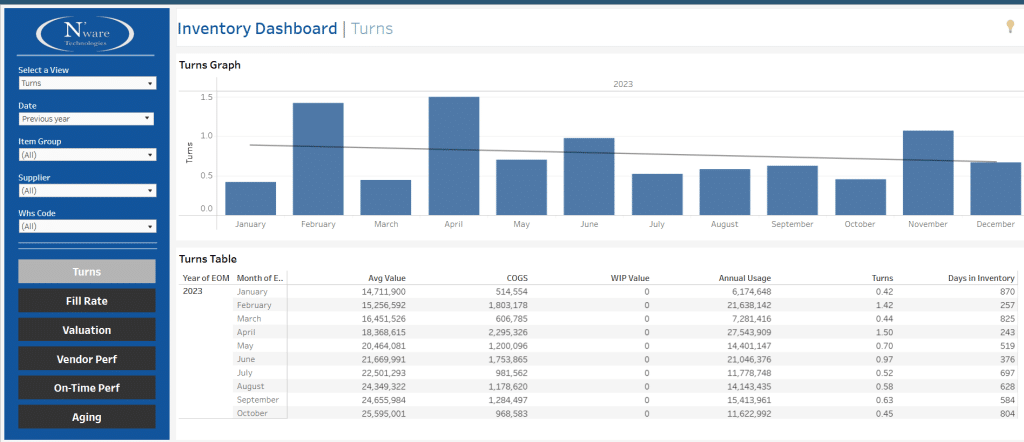
Small and midsize businesses operating in consumer-packaged goods (CPG), multi-brand distribution, and marketing industries face relentless competition and ever-evolving market dynamics. To thrive in this landscape, smaller enterprises need a strategic advantage that enables them to make informed decisions, optimize operations, and stay ahead of the curve. This is where business intelligence (BI) emerges as a game changer for wholesale distributors supplying the retail industry.
In this article, we will explore key metrics, KPIs, and concepts that can be quickly implemented by Consumer Packaged Goods and distribution businesses to turn unused data into concrete business value in areas such as operational excellence, procurement/negotiating with vendors, inventory activities, and identifying market trends, consumer behaviors or new market opportunities.
Collecting Consumer Packaged Goods Data with Source-Agnostic Software
CPG Brands sit on an incredible wealth of data from both internal and external sources, which require a “platform-agnostic” analytics software to maximize the value of their BI environment, meaning that a solution or approach is not dependent on any specific data source. In the context of business intelligence, being “source-agnostic” signifies the ability to work and combine data from different sources interchangeably, without being tied to a particular platform. This flexibility enables growing CPGs to bring their reporting game to the next level while ensuring future platform scalability.
Internal Sources:
Internal data are generated within a company and represent the lowest-hanging fruit available. By analyzing and leveraging internal data, organizations can see trends among their client base, identify bottlenecks, and optimize processes.
Examples of internal software include
- ERP and financial systems
- Supply chain/WMS data
- E-commerce and market places
- CRM
- Website analytics
Syndicated Data (External Sources 1/2):
Syndicated data refers to market research data that is collected and aggregated by third-party research firms (such as NielsonIQ or IRI) from various retailers and stores. This data is typically collected on a regular basis, often weekly or monthly, and encompasses a wide range of information related to product sales, pricing, and consumer purchasing behavior.
Examples of Syndicated Data Sources
- Point-of-sale (POS) or sell-out data (absolute market numbers think benchmarking/market shares)
- Panel data
- Shopper data
- Household data
Retail Direct Data (External Sources 2/2):
Retail direct data is usually acquired through major retailers such as Walmart, Best Buy or CVS, but can also be available from smaller carriers. This data provide insight visibility into consumer purchasing behavior and sales performance at the retailer/store level.
Examples of internal software include
- Point-of-sale (POS) or sell-out data (from individual retailers)
- Panel data
- Shopper data
That much data can definitely become overwhelming for any team trying to manually digest such volume of information – leaving a lot of for human errors along the way… And that is where business intelligence software such as come into play!
Metrics, Dashboards and KPIs for Consumer-Packaged Goods Businesses
Now that we have looked at some of the main data sources for CPG Brands, let’s see how they can leverage this information to can turn into insights.
Internal measurements refer to metrics that a company collects within its own operations – things like sales figures, inventory levels, production outputs, employee stats, and so on. These provide insight into how efficiently the business is running on a day-to-day basis.
External measurements analyze how the company is perceived and performing outside its direct control. This could mean third party rankings, consumer opinion surveys, market share analytics, social media sentiment, factors like weather that impact sales, and more. It gives a sense of how the business interacts with customers and stacks up against competitors.
The internal data is more tangible and within the business’s power to influence directly. The external shows less controllable influences and guards against complacency, helping ensure they understand customer needs.
Together, both types of measurements can reveal strengths to build on or problems to address.
Market Share
Market shares are among the top indicators of brand marketing companies performance and competitiveness within a market. Studying market share trends empowers CPG marketers to gauge competitive dynamics, strategic positioning, brand health and whether initiatives taken have delivered the desired impact relative to rivals nationwide, within key sub-markets, or at the retailer level.
Customer Segmentation
Customer segmentation involves dividing the total basket of consumers into meaningful subgroups based on shared such as demographics, purchasing behavior, or preferences in order to develop targeted marketing strategies. This enables brands to identify purchasing patterns among group of clients, customize marketing campaigns based on a segment’s preferences and focus resources on high-value targets.
Distribution Rates
Distribution rate refers to how widely a brand’s entire portfolio/SKUs (stock keeping units – individual products) are placed on shelves across all locations of a retailer. It’s measured by looking at how many of that retailer’s stores or “banners” (different brands within a larger chain) are carrying any of the company’s products.
For example, if a CPG brand has its items in 7,500 of a major grocery chain’s 10,000 total stores, its distribution rate would be 75%.
Penetration Rates
Penetration rate focuses on product assortment within each specific location, not just whether anything from the brand is there. It evaluates what percentage of a company’s total catalog is represented on shelves at each store/banner that does carry it.
For example, let’s say a jam company has 12 flavors. A store may space for 6-8 varieties. If they routinely stock 5/12, the penetration rate would be around 42%.
Gap Analysis
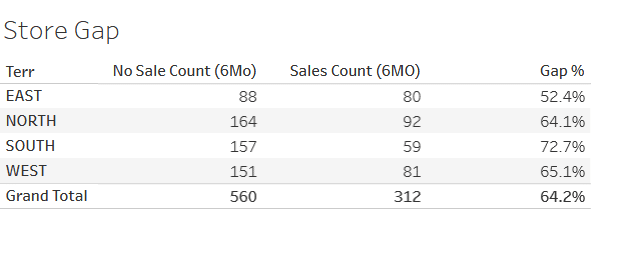
At its core, gap analysis is a tool CPG companies use to evaluate the differences between a company’s current performance and its desired or intended goals. More specifically, it allows CPGs to identify locations or retailers that are not purchasing the desired volume of specific products or category. By comparing internal sales performance data to external factors like customer demographics, competitors’ offerings, etc., gaps in distribution, promotion, assortment are uncovered.
For example, a mid-size cosmetics distributor aims to increase marketing share by 5% in the premium skin care products. Their current market share for that product category is 3%. The market share gap is 2%.
Simple Gap Analysis by Store or Retailer
Online Sales Impact
Analyzing the online sales impact is an important part of a modern gap analysis. With more consumers shopping online every day, it’s critical for CPG brands to understand how their e-commerce business affects brick-and-mortar sales, operations, and overall profitability.
Example: After the successful launch of their e-commerce Website, a health products distributor notices a 10% decrease in in-person purchases. Drilling into data, they realize that 75% of digital orders came from existing customers. This high cannibalization rate meant the website was pulling shoppers from the physical locations.
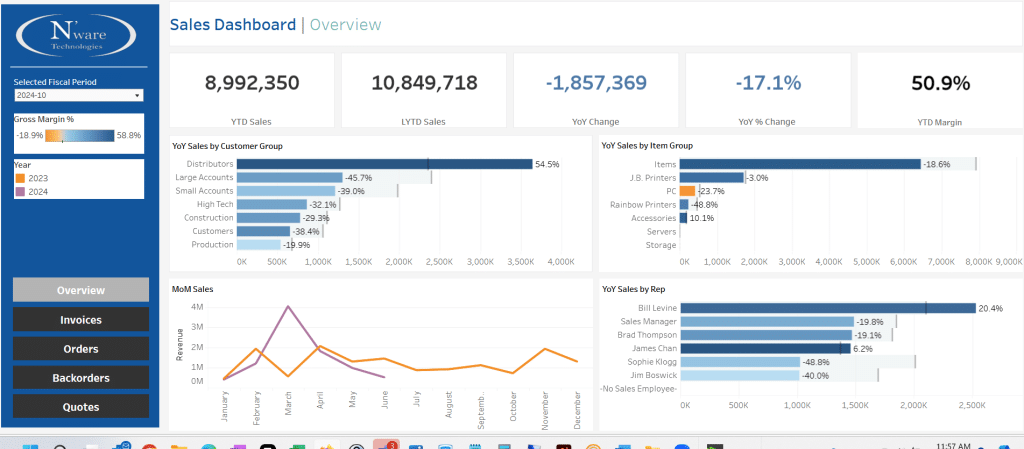
Sales Analysis Dashboard Example
Price Volume Mix
For CPG companies, price volume mix refers to the impact that changes in pricing, volume of units sold, and product mix have on total revenue and profitability. It’s an important indicator of sales performance that companies closely monitor.
For example, a food and drinks distributor raised soda prices 5% but saw volumes fall 5% due to the economy. Meanwhile, consumer preferences shifted the product mix to favor lower-priced sparkling water over soda. The combined impact resulted in a 3% drop in total yearly revenues.
Promotions (Discounts vs. Buy One Get One (BOGO))
Promotion analysis shows the true impact and return on investment of marketing programs vs actual sales. Historical metrics on promotional lifts, promotion types, consumer preferences, paybacks etc. enable setting evidence-based targets when organizing future events with trade partners. This allows fine-tuning budgets towards the most impactful initiatives.
Example: By collecting and analyzing point-of-sale and customer loyalty data, the CPG company learned that their buy-one-get-one-free promotion outperformed a 30% discount offer at driving new customer trials and repeat purchases. However, traditional percentage discounts proved better for increasing cart sizes. Ongoing business intelligence helps maximize returns by identifying which promotional techniques resonate most with customers.
New Products
By monitoring KPIs such as purchase rates, distribution gains, velocity, attachment rates, and repeat purchase rates early and often, issues can be addressed and successes reinforced through promotion or expansion. The right new products delivered at optimal pace are vital to invigorating sales growth, while those lagging can be cut before wasting further resources.
Example: After launching a new granola bite product nationally. early readouts of velocity, attachment and repeat rates from her analytics showed good acceptance, except lagging repeats in California. Drilling into store-level data there, she saw distribution was lower than peers. Armed with this insight, the sales team successfully lobbied retailers to expand distribution on the West Coast, overcoming the one obstacle and ensuring consistent growth rollout across markets.
Analysis of Sales at the Retailer/Banner Level
Retailer/banner level analysis looks at a brand’s performance aggregated within a particular retailer or chain, such as across all Walmart stores. It focuses solely on one brand’s own sales pattern within that trade partner.
Retailer analysis example: The Walmart banner analysis revealed stronger sales growth and category share gains for the CPG brand in Neighborhood Markets versus Supercenters, highlighting opportunities to modify assortment or promotions based on format.
Store-Level Detailed Sales Data (POS) – Competitive Brands
Store-level POS data shows metrics down to individual store addresses, allowing even richer and more granular intra-retailer comparisons. Store-level competitive POS includes competitors’ numbers scanned from checkouts also. This reveals relative market share dynamics store-by-store.
Example: Analysis of scanner data from individual retailers uncovered varying competitive dynamics between brands store to store, from market leaders grabbing the largest share to close battles for the top spot, providing granular targeting cues.
Sell-Through Analysis
Calculating sell-through rates which represent how quick on-hand inventory is sold through to consumers within a given period, often weekly or monthly. It is widely used by CPG Brands to forecast demand for specific retailers, markets or territories.
For example, a dairy company could find that a new peach-flavored yogurt in the Mid-West is only achieving a 60% sell-through rate versus the category average of 75%. Knowing this, the sales and marketing teams can dig deeper to learn the root cause of the issue.
Conclusion
Putting together a smart and sustainable business intelligence strategy requires both experience and expertise. As Partners of your success, N’ware’s holistic team of business consultants can implement, integrate, advise, customize, or train your team on the leading BI platform Tableau and PowerBI. Get in touch with our team today to learn how we can help your business can tap into its very own data gold mine.
Plug and Play Business Intelligence for CPG using SAP Business One
If you’re using SAP Business One, consider N’Sight—our plug-and-play BI solution designed specifically for CPG companies. With preconfigured dashboards and KPIs, N’Sight makes it super easy and fast to turn your data into actionable insights. Don’t miss out on this opportunity to streamline your operations and stay ahead of the competition. Contact us today to discover how N’Sight can transform your business intelligence experience!


